Overview
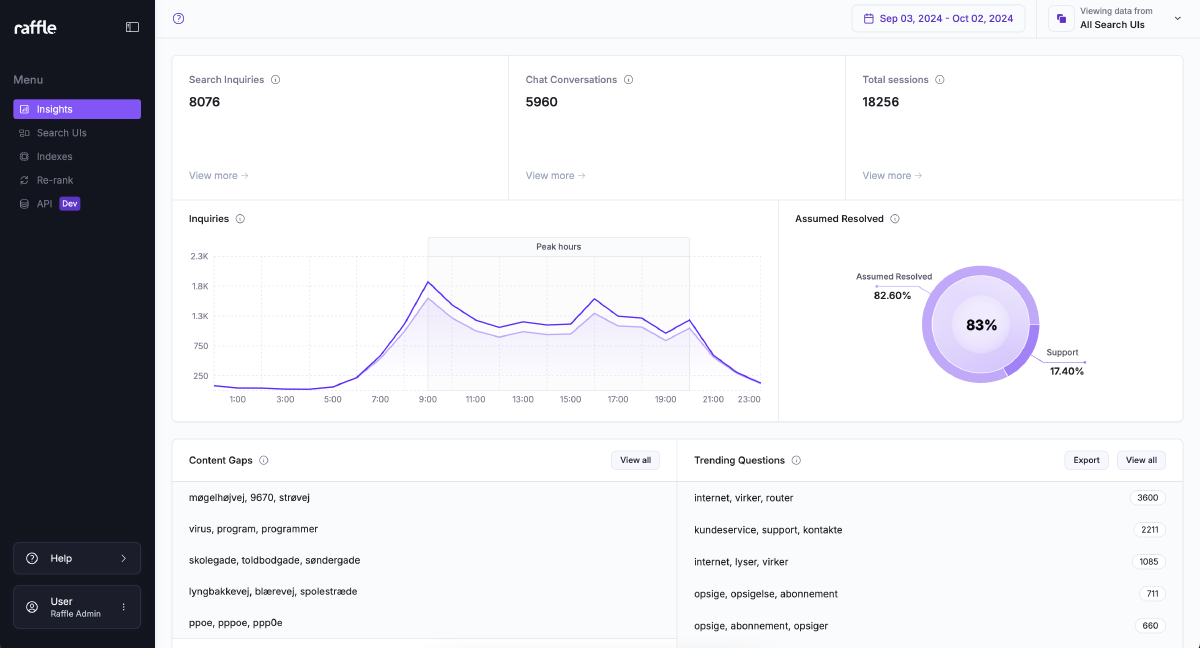
Raffle Insights Dashboard
Filters
In the top right corner of the Insights dashboard, you will find a couple of filter options.
- Select Date:
By default, the dashboard displays data that has been collected over the past 30 days.
However, you can select your desired date range either by our suggested time-frames of today, yesterday, last 7 days, and last 30 days or by picking the specific dates for which you want to see the data. Once you have selected the dates you wish to see, click APPLY to see the effect.

Date Filter
- Viewing data from:
Do you have more than one search UI? It might be that you have your search UIs set up on different domains, or on different pages. Sometimes data can look different depending on your search UI. Therefore, we have the option for you to view data and compare data based on your tool.
Toggle between your search UIs to see the data applicable to each of your tools. By default, the data that is initially displayed when opening the Insights dashboard is the data collected from all your live Search UIs.

UI Filter
- Knowledge Base:
If you have Search UIs set up for different languages, you can select for which language you wish to see the data. The initial data that is displayed when switching to a new language knowledge base is the data collected from that language over the past 30 days. Choose a specific Search UI or date range in the same was as it has been explained above.

Language Filter
Search Inquiries:
In the top left corner you will find the data for the number of search queries based on your selected filters (as introduced in the previous section). By clicking “view more” you will find two additional data points:
- Click-through rate:
Displays the percentage of how many times a user has clicked a search results relative to the total number of queries. This data can be useful for identifying high-performing content as well as an identification of whether content should be optimised to increase user engagement.
- Average queries per search session:
This number is a calculation of the average number of queries made per search session. More information about what makes a search session, can be found here.
Chat conversations:
If one of your tools is chat, you will be able to find data collected for chat conversations at the top of the dashboard. If you do not have chat as a product, you will find this field empty in your Insights dashboard. By clicking “view more”, you will find two additional data points:
- Average Chat Conversations per Chat Session:
The number displayed here is a calculation of the average number of chat conversations initiated per chat session. A new conversation is started whenever the user starts over during the same visit or refreshes the page. By clicking “view more” you are able to see the entire chat conversation history.
- Average queries per chat conversation:
The number displayed here measures the average number of queries asked per chat conversation. This number gives an indication of the length of the conversation your users have with the chat, but it also provides you with the unique opportunity of understanding your users’ chat interaction and user needs to tailor responses (campaigns and banners) s well as enhancing chat-based support efficiency.
Total sessions:
The number displayed here shows the total number of sessions. A session lasts 10 minutes and begins once a user clicks a search or chat widget. If a user is still actively using the search or chat after 10 minutes, a new session will be allocated to the user. This number can help track the user engagement with the widget in relation to placement or design effectiveness.
- Empty sessions:
Empty sessions tracks the instances where sessions are initiated but no queries or chat conversations occur. This number can help identify user experience issues, optimise widget placement or visibility to reduce empty sessions, and improve engagement.
- Type of device:
Track the device type (desktop or mobile) used by users when initiating a session.
Inquiries:
Track the peak hours for search inquiries and use it as a tool for understanding and planning for resource allocation. The number displayed shows the trends for inquiries within the chosen timeframe.
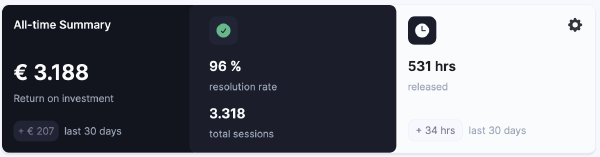
All-Time Summary
The All-time summary section displays the total aggregated data for the whole period when a Raffle widget has been live and active on a platform.
All-Time Summary
- Return on Investment: Return on Investment is the total amount saved by the customer when using Raffle Search. This is calculated by the company-specific average time to solve a case and average cost per inquiry.
Steps
- Click the gear icon on the top right corner of the All-Time Summary section
- Enter average time to resolve a case (in minutes)
- Enter average cost per inquiry
- Choose currency
- Click SAVE
-
Resolution Rate: Total Resolution Rate is the total percentage of how well Raffle performs in resolving search inquiries.
-
Total Sessions: Total Sessions is the total number of search sessions made with Raffle Search since being implemented on a platform.
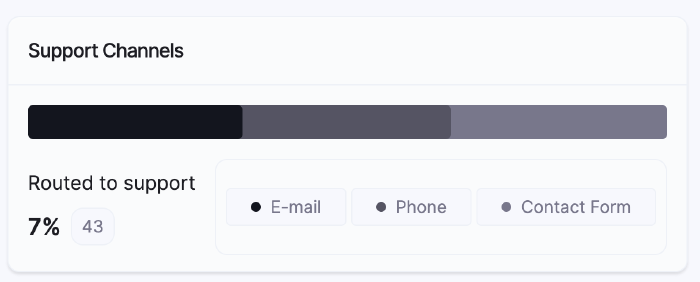
Support Channels
The Support Channels section displays the percentage and breakdown of Customer Support option usages for users who asked questions and opted to contact Customer Service on the chance that they did not find what they were looking for.
These search sessions are considered unresolved, and are calculated based on the number of questions routed to support, divided by the total number of sessions for a specific period of time.
Support Channels
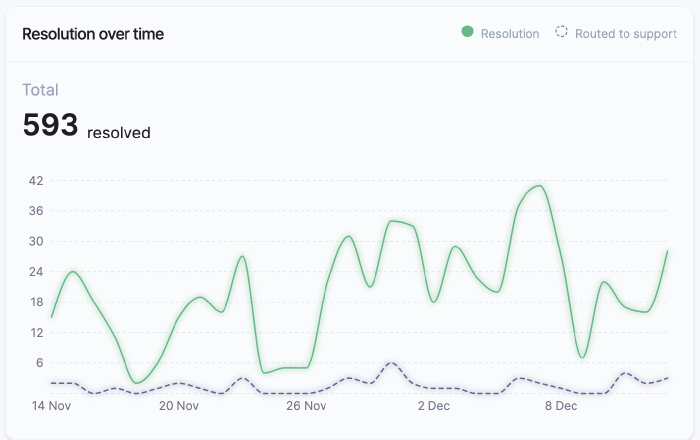
Resolution Over Time
Resolution over time displays the total number of sessions that have been resolved versus the number of sessions that were considered unresolved for a specific period of time.
-
Resolved Session: A search session is considered resolved if a user performs a search and decides to either click a result or leave the widget, with the assumption that the user found what they were looking for without requiring any further action.
-
Unresolved Session: A search session is considered NOT resolved if a user performs a search and then tries to contact Customer Service from the widget, with the assumption that they did not find what they were looking for and are now opting for further CS interaction.
Resolutions Over Time
Distribution of Sessions
Distribution of sessions displays the average number of unique sessions for the selected period of time.
A session is a 10-minute window that captures and collects user actions such as searching, clicking on answers, contacting support, etc.
Each search session is started when a user starts interacting with the widget on a page and expires after 10 minutes. This limit is meant to capture searches that are likely related (e.g. refining a search after each try). This means that:
- If the same user performs another search after 10 minutes, even without leaving the site, this is then counted as another session
- If a user moves to another page, that is counted as a new session since the widget is newly loaded when launched
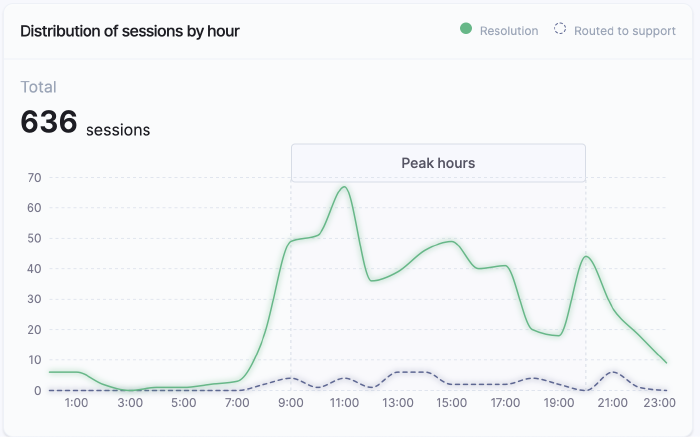
Distribution of Sessions